Storm Lead Engine
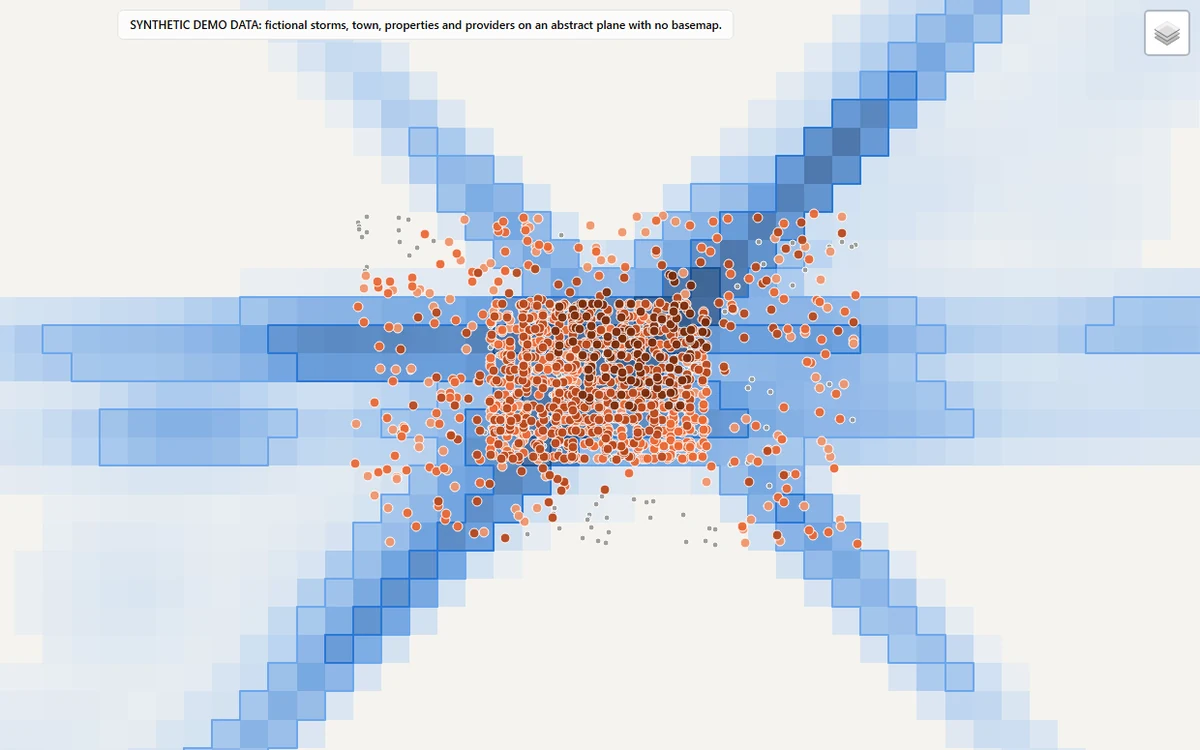
After a hailstorm, the useful question isn't where it hailed. It's which roofs took enough hail to be worth an inspection. This reads NOAA's radar hail estimates, maps where 1, 1.5 and 2 inch hail fell, and records the hail each property has taken since its current roof went on.
Each property gets a score where every point is visible, and contractors are ranked so a 5.0 from three reviews doesn't beat a 4.8 from four hundred.
View the code (opens in a new tab)Read the README (opens in a new tab)Open the live map (opens in a new tab)
The problem
After a storm, decide which roofs took enough hail, on the roof that's there now, to justify an inspection.
What I built
An engine that traces hail footprints from NOAA's MRMS radar product, pins each property to a radar cell, records every hit since the roof was last replaced, and ranks properties and service providers.
What it produces
A ranked property list, a provider ranking, hail footprints as GeoJSON, a run summary and an interactive map.
First built for a roofing client. This version uses a made-up storm season and town.
Hail grids follow NOAA's public MRMS format. The demo storms, properties and providers are synthetic.
In pictures
How it works
- Ingest. Storm-day hail grids from NOAA's public archive or the bundled synthetic season.
- History. Storm days are merged into events and every hit on each property's current roof is recorded.
- Swaths. Cells above 1, 1.5 and 2 inches are traced into exact footprint polygons.
- Scoring. Hail confidence, the property lead score and each provider's shrunk rating.
- Ranking. Eligible properties are ranked and matched to a provider that covers them.
- Report. A ranked CSV, provider ranking, GeoJSON footprints, a run summary and a map.
Where to look in the code
README sections
- Overview (opens in a new tab) The problem and what the engine does
- Hail history on the current roof (opens in a new tab) Why a 2019 storm does not count on a 2022 roof
- Lead score (opens in a new tab) The points score, component by component
- Provider quality: Bayesian shrinkage (opens in a new tab) How review counts change a rating
- Quickstart (opens in a new tab) Run the demo yourself
- Limitations (opens in a new tab) What it does not do
Files
- src/storm_lead_engine/swaths.py (opens in a new tab) Hail-swath footprints
- src/storm_lead_engine/history.py (opens in a new tab) Per-roof hail history
- src/storm_lead_engine/scoring.py (opens in a new tab) Lead score and shrinkage
- tests (opens in a new tab) Test suite
- Automated checks (opens in a new tab) lint, type checks and tests on every push