Thesis to Target
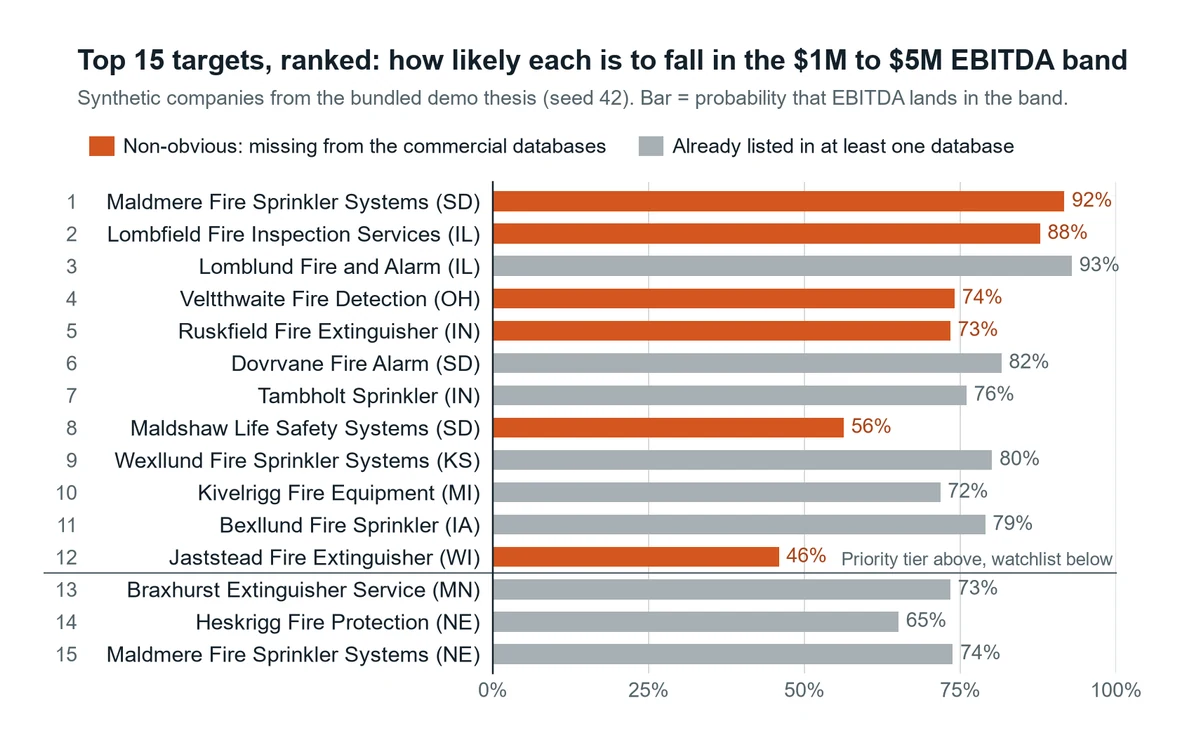
Most buy-side firms source deals from the same few databases, so the same companies get called by every buyer. I built a tool that pulls company records from licenses, registries and directories, merges the duplicates into companies, and estimates the probability that each company's EBITDA falls in the buyer's range.
It also checks whether each company already shows up in the big databases, which tells a buyer where other firms probably aren't looking. Every number in the output links back to the record it came from.
View the code (opens in a new tab)Read the README (opens in a new tab)
The problem
Find private companies that fit a buyer's investment thesis, including the ones the big databases don't list.
What I built
A pipeline that reads a thesis (industry, EBITDA range, geography), pulls overlapping records from several messy sources, merges them into companies, scores sector fit, estimates EBITDA as a probability distribution and checks database presence.
What it produces
A ranked target list, a workbook and a short brief. Every claim goes into an evidence ledger with its source and a confidence level.
First built for a buy-side M&A origination firm. This version runs on made-up companies.
All company data is synthetic, generated from a seed. No real business is described.
In pictures
How it works
- Sources. Each adapter maps one messy feed onto a common record shape.
- Entity resolution. Records are normalized, compared within cheap blocks and clustered into companies. Borderline pairs go to a review queue.
- Sector fit. License, NAICS and keyword evidence set a fit tier from A to D.
- EBITDA estimate. Size signals become a log-normal EBITDA distribution and the probability EBITDA falls in the thesis band.
- Presence check. Each company is looked up in the large databases to score how obvious it already is.
- Screen and rank. Geography, fit and ownership screens set scope. A weighted composite ranks the rest.
- Exports. A ranked CSV and workbook, the evidence ledger, the review queue and a short brief.
Where to look in the code
README sections
- Overview (opens in a new tab) The problem and what the system does
- EBITDA estimate and P(EBITDA in band) (opens in a new tab) How a company's size signals become a probability
- Obviousness (opens in a new tab) How it scores whether other buyers already know a company
- Evidence ledger (opens in a new tab) How every claim is tied back to its source
- Quickstart (opens in a new tab) Run the demo yourself
- Limitations (opens in a new tab) What it does not do
Files
- src/thesis_to_target/resolve.py (opens in a new tab) Entity resolution
- src/thesis_to_target/estimate.py (opens in a new tab) EBITDA distribution
- src/thesis_to_target/evidence.py (opens in a new tab) Evidence ledger
- tests (opens in a new tab) Test suite
- Automated checks (opens in a new tab) lint, type checks and tests on every push